Overview
Note
Estimated time to complete: 15 Minutes
In this exercise you will use one of the common tools that can accelerate resolution of support cases: Nutanix Cluster Check (NCC).
Cluster Details
Use the information from you Instructor to locate and access your Cluster
.. Using the spreadsheet below, locate your Group Number and corresponding details for your assigned cluster.
References
The following links are provided for reference and not required to complete the lab exercise.
NCC
What is NCC?
Nutanix Cluster Check (NCC) is a framework of scripts that can help diagnose cluster health. NCC can be run provided that the individual nodes are up, regardless of cluster state. The health checks collect critical information regarding anomalies, Cassandra, data protection, hardware, hypervisor, network, Stargate, and more.
When would I run NCC?
As an SE, you would typically run NCC after a POC installation to ensure there are no immediate issues with the cluster, such as a misconfigured NTP server. Additionally, NCC should be run and the results attached to support cases. Providing this information proactively to support can often drastically reduce troubleshooting time.
All default checks are non-intrusive and can be run without concern for impacting the cluster.
You down with NCC?
Yeah you know me!
Log into Prism on your 3-node POC cluster (10.42.XYZ.37).
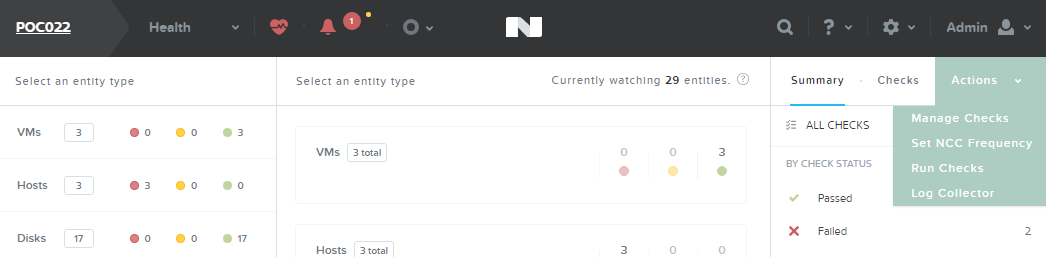
Open Prism > Health and click Actions > Run Checks.
Note
NCC can also be configured to run every 4 hours, daily, or weekly and the results will be e-mailed to all E-mail Recipients defined in Alert E-mail Configuration in cluster settings.
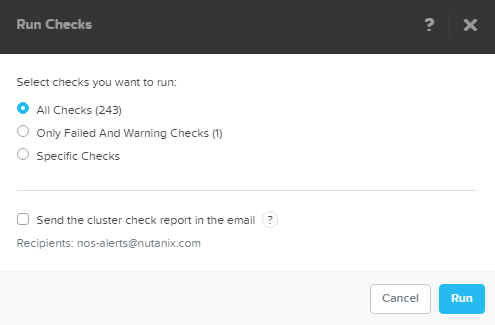
Select All Checks. De-select Send the cluster check report in the email. Click Run.
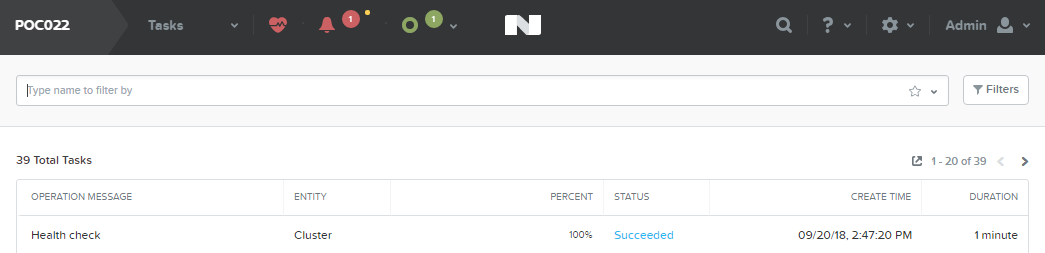
Select Prism > Tasks and wait for the Health check to reach 100%.
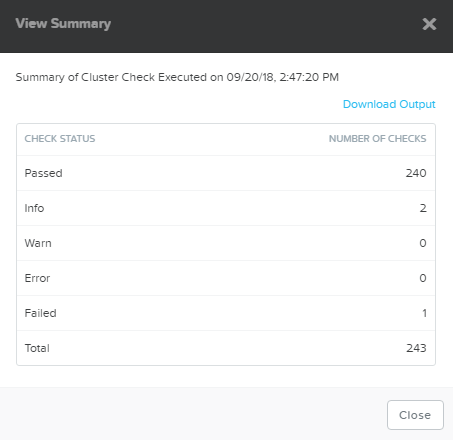
Click Succeeded under Status to view the report summary. Click Download Output for the details of any non-Passed tests.
Review the output and note specific KB articles are cited for common issues.
Example NCC Output
NCC Version  :3.5.0.1-2532387a
Cluster Id  :30391
Cluster Name  :POC022
Cluster Ips  :['10.21.22.29', '10.21.22.30', '10.21.22.31']
Timestamp  :Thu Sep 20 19:46:07 2018

################################################################################
SUMMARY RESULT
################################################################################

Detailed information for lsi_firmware_rev_check:
Node 10.21.22.30:
FAIL: LSI firmware revision is less than the minimum supported revision 0x9000000
Node 10.21.22.31:
FAIL: LSI firmware revision is less than the minimum supported revision 0x9000000
Node 10.21.22.29:
FAIL: LSI firmware revision is less than the minimum supported revision 0x9000000
Refer to KB 3035 (http://portal.nutanix.com/kb/3035) for details on lsi_firmware_rev_check

Detailed information for auto_support_check:
Node 10.21.22.29:
INFO: SMTP check failed. Unable to send emails.
Refer to KB 1585 (http://portal.nutanix.com/kb/1585) for details on auto_support_check

Detailed information for dns_server_check:
Node 10.21.22.30:
INFO: Only one name server is configured
Node 10.21.22.31:
INFO: Only one name server is configured
Node 10.21.22.29:
INFO: Only one name server is configured
Refer to KB 3005 (http://portal.nutanix.com/kb/3005) for details on dns_server_check
+---------------+
| State | Count |
+---------------+
| Pass  | 174   |
| Info  | 2     |
| Fail  | 1     |
| Total | 177   |
+---------------+
The ncc-output-YYYY-MM-DD-TIME.txt file is what should be attached to new support cases.
Log Collector
What is Log Collector?
Log Collector is an NCC plugin used to bundle logs present on the CVM. By default, all levels of logs are collected (INFO, ERROR, WARNING, FATAL). Refer to `KB1406 <https://portal.nutanix.com/#/page/kbs/details?targetId=kA0600000008cPfCAI>`_ for complete details on all services, alerts, and cluster configuration details collected.
When would I run Log Collector?
Log Collector bundles are critical for any offline analysis of a Support Case or Engineering ONCALL Case.
Log Collector is a resource intensive task. Running it for a long period might cause performance degradation on the Controller VM where you are running the Log Collector. Use caution if business needs require peak performance levels. In this case, run the Log Collector during a maintenance window if possible.
All logs gathered should be uploaded to the Support Case via https://portal.nutanix.com.
Log into Prism on your 3-node POC cluster (10.21.XYZ.37).
Open Prism > Health and click Actions > Log Collector.
Select Collect Logs starting now and use the default collection period of 4 hours. Click Run Now.
Note
Logs can also be collected from a custom date/time range, for example, if an issue occurred during the middle of the night but troubleshooting didn’t begin until the following day. Logs can be collected covering a time period of 4 to 24 hours.
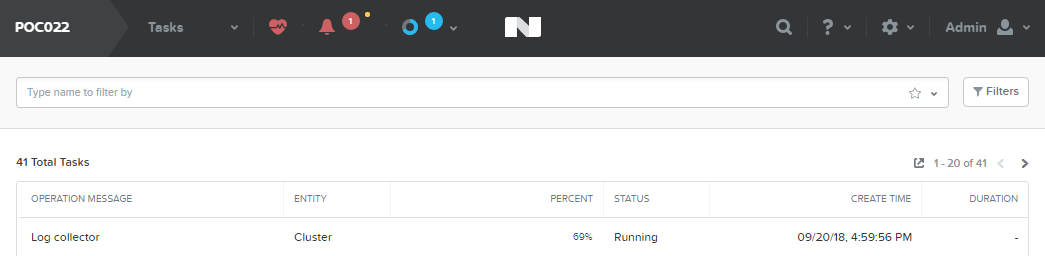
Select Prism > Tasks and wait for the Log collector to reach 100%.
Click Succeeded under Status to download the NCC-logs-YYYY-MM-DD-TIME.tar file.
Note
By default, Log Collector does not anonymize (obscure) output for fields such as e-mail addresses, IP addresses, cluster name, etc.
To obtain a Log Collector bundle with anonymized data, connect to any CVM via SSH and executing the following command:
nutanix@CVM$ ncc log_collector --anonymize_output=True
Refer to KB1406 for complete details command line execution.